
PRUDiscovery
A needs analysis application to discover your financial goals
My role
Product Designer - UX Strategy,
Research, Wireframes,
Visual Design, Prototyping
PRUDiscovery is a self-help needs analysis application that allows customers to explore the bigger goals they have in life, evaluate how well-prepared they are, and be ready to buy suitable products to meet their needs.
Background
Origin Story
(How it worked before)
Initially our vision was to build an integrated journey with our online financial planner and sales tool, PlannerX, to enable cross-platform data flow for a consistent experience. We worked with Apple and ran discovery sessions with our customers and financial consultants to build a solid product strategy and MVP for launch. However, we learned that our initial approach had to be altered due to new insights and changes in strategic direction.
Re-design Limitations
The existing calculator was barely used and proved to be problematic in having many fundamental usability and performance issues. In light of the COVID pandemic, with budget cuts amidst, many of the new features we wanted to design and develop were placed on hold.
We were limited by what was previously built, so we needed to come up with a more user-friendly solution for the first phase that was built on top of the existing calculator.
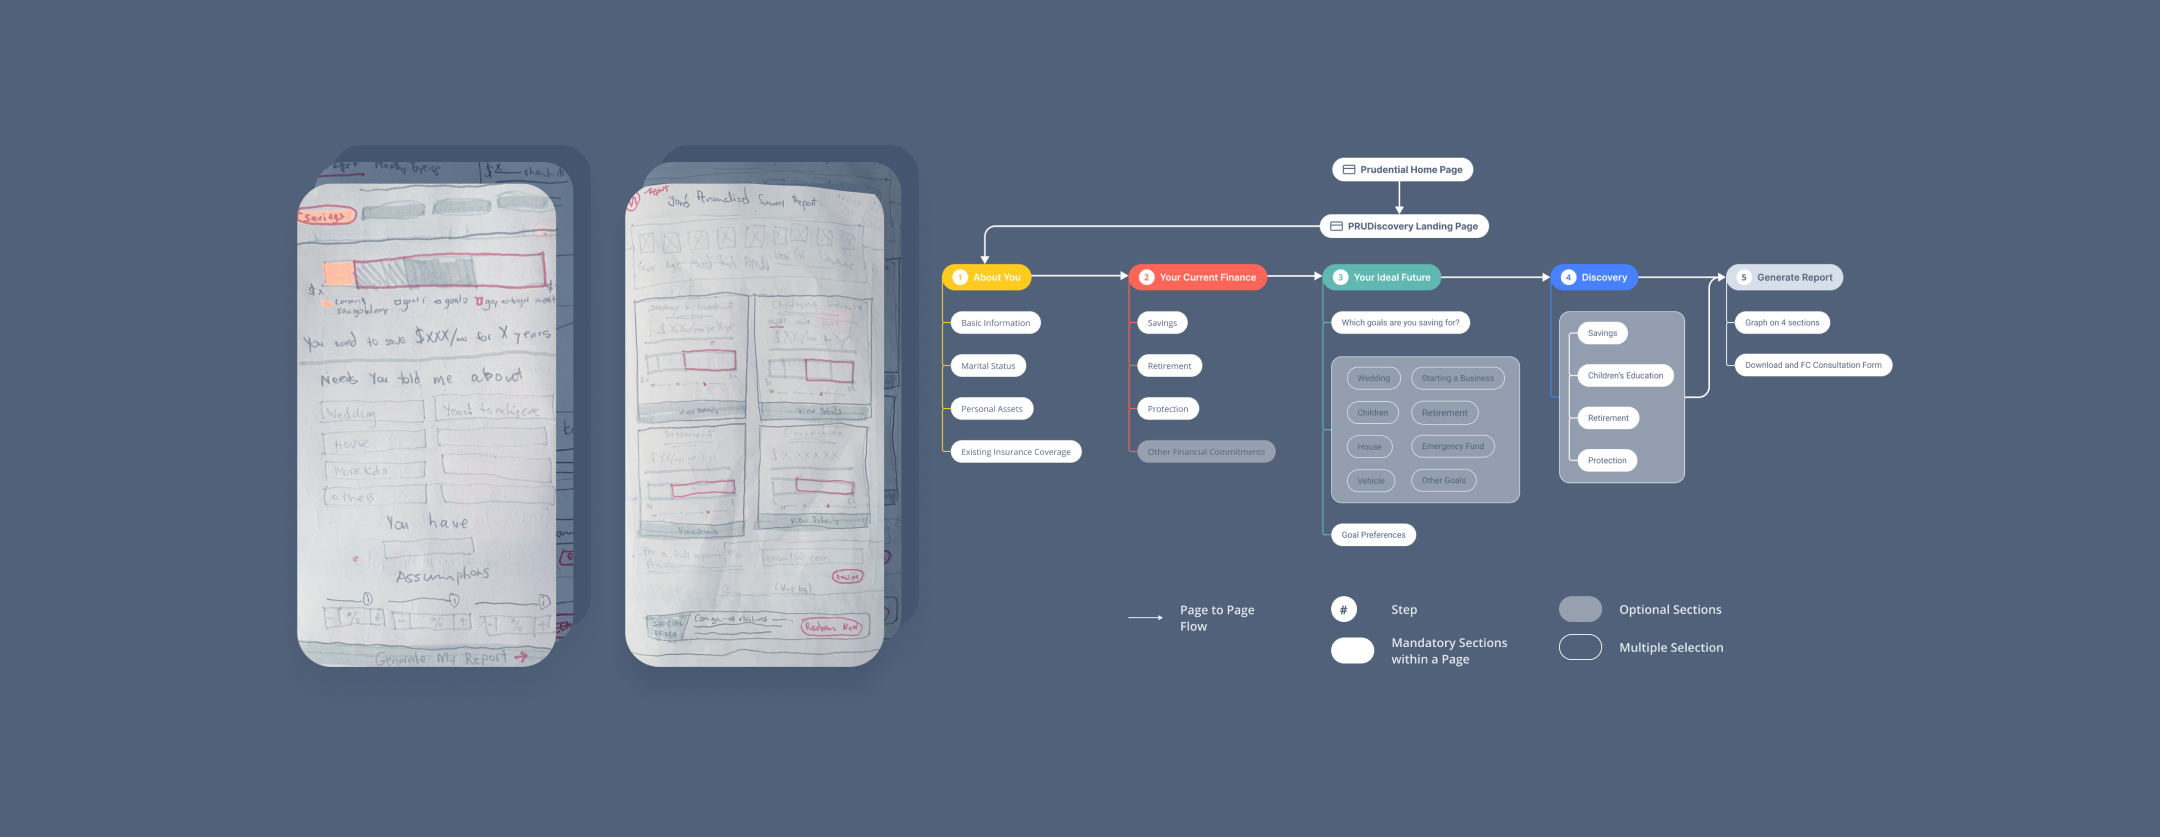
The previous PRUDiscovery application
Role
I was tasked to rethink and rebuild an engaging experience from the ground up, catch up to new standards, reevaluate user flow, rebuild IA, and redesign visuals.
Define the Problem
How might we help people discover their needs in areas of protection, savings, children’s education, and retirement, so they can make informed insurance purchase decisions not only once in a life but through life’s changes, opportunities and uncertainties?
Project Goals
Help people evaluate their goals and make informed insurance purchase decisions
Create high potential new leads with financial consultant assignment
Build on customer
trust by improving content and a
frictionless journey
Rethink the information architecture to accommodate for new features down the road.
Process and Approach
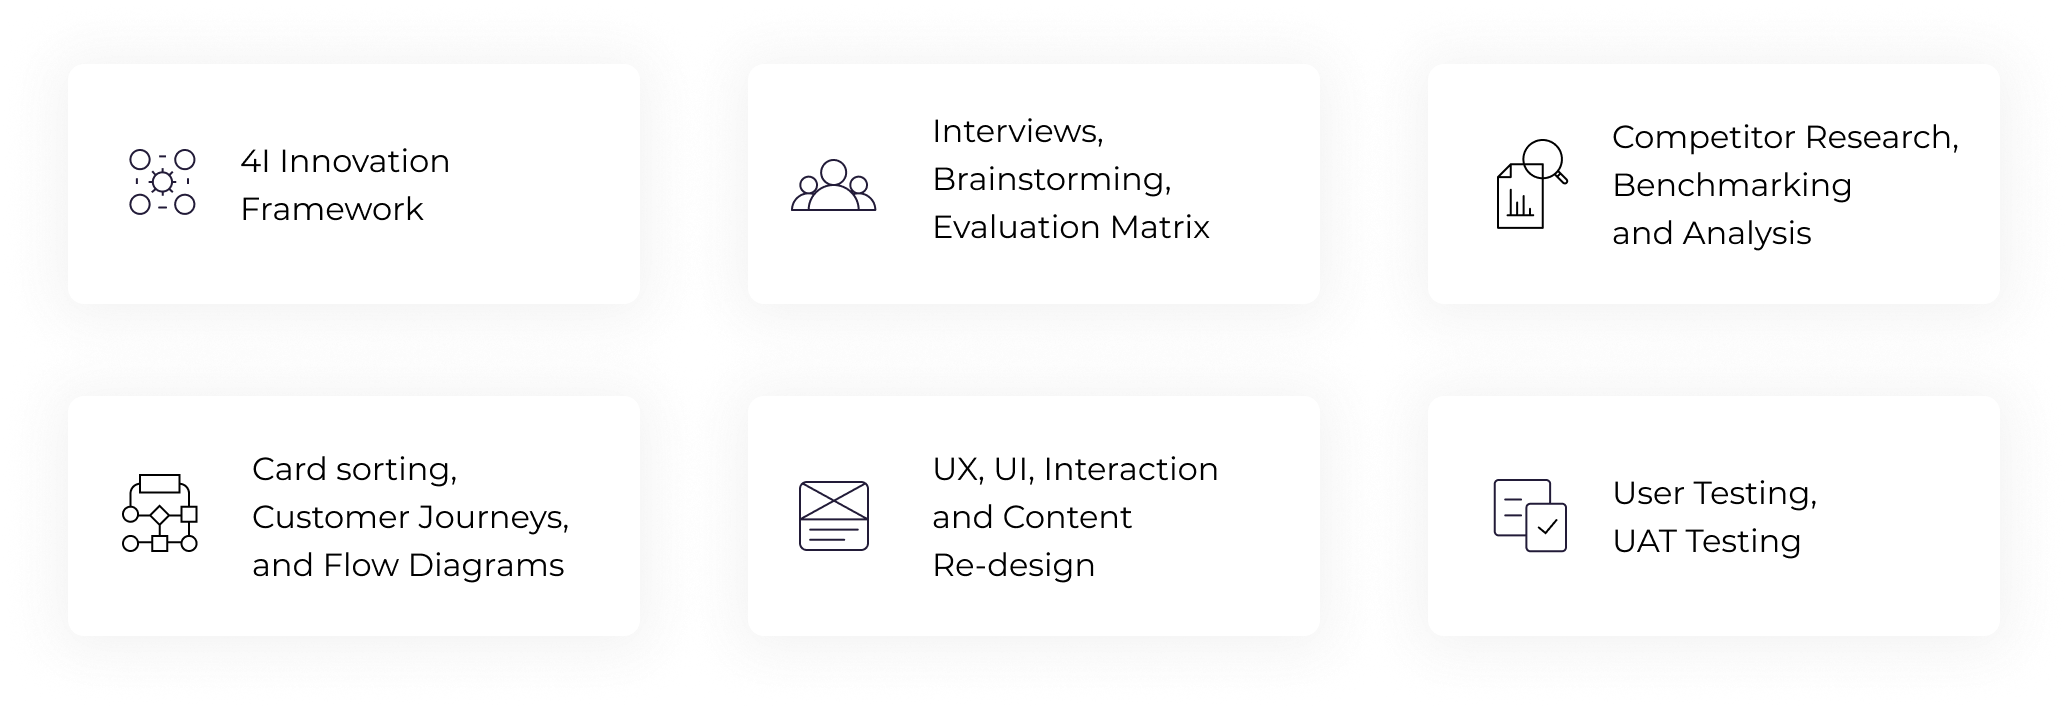
Methodologies Used
Competitor Research
We extensively examined the user experience and visual direction of direct and indirect competitors as well as external sources of inspiration to identify opportunities.
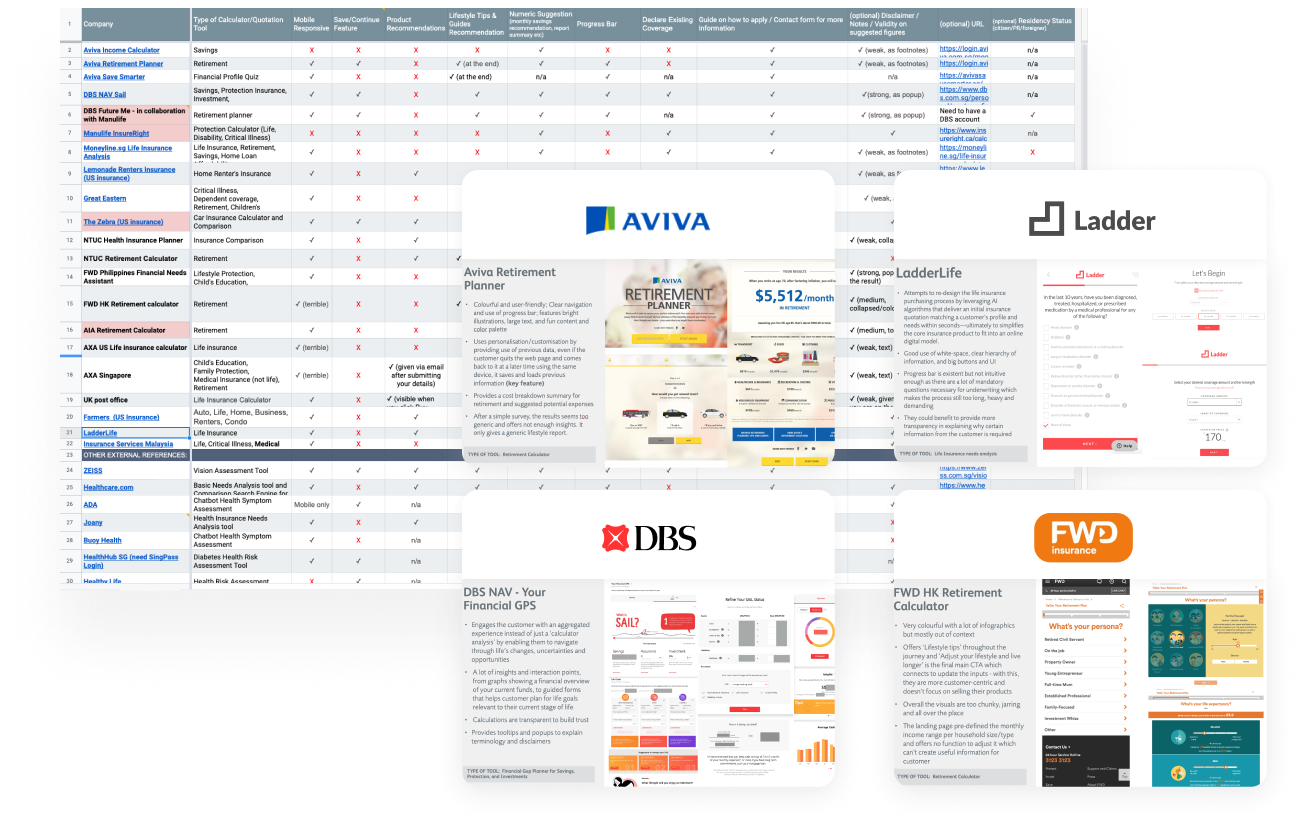
Key Findings
- Provide insights and personalization to make customers feel that it is more than just a calculator but also a life journey they plan.
- Use it to help customers learn about coverage gaps and what actions they should take.
- Ensure clear organization, labeling, and navigation, with a progress bar for guidance.
- Make sure it works well on mobile and allows users to save and update their data easily.
Know Your Customer
We took a ‘customer-first’ design approach inspired by the 4I Innovation Framework we follow at PRU which helped us narrow down the solution design we wished to achieve.
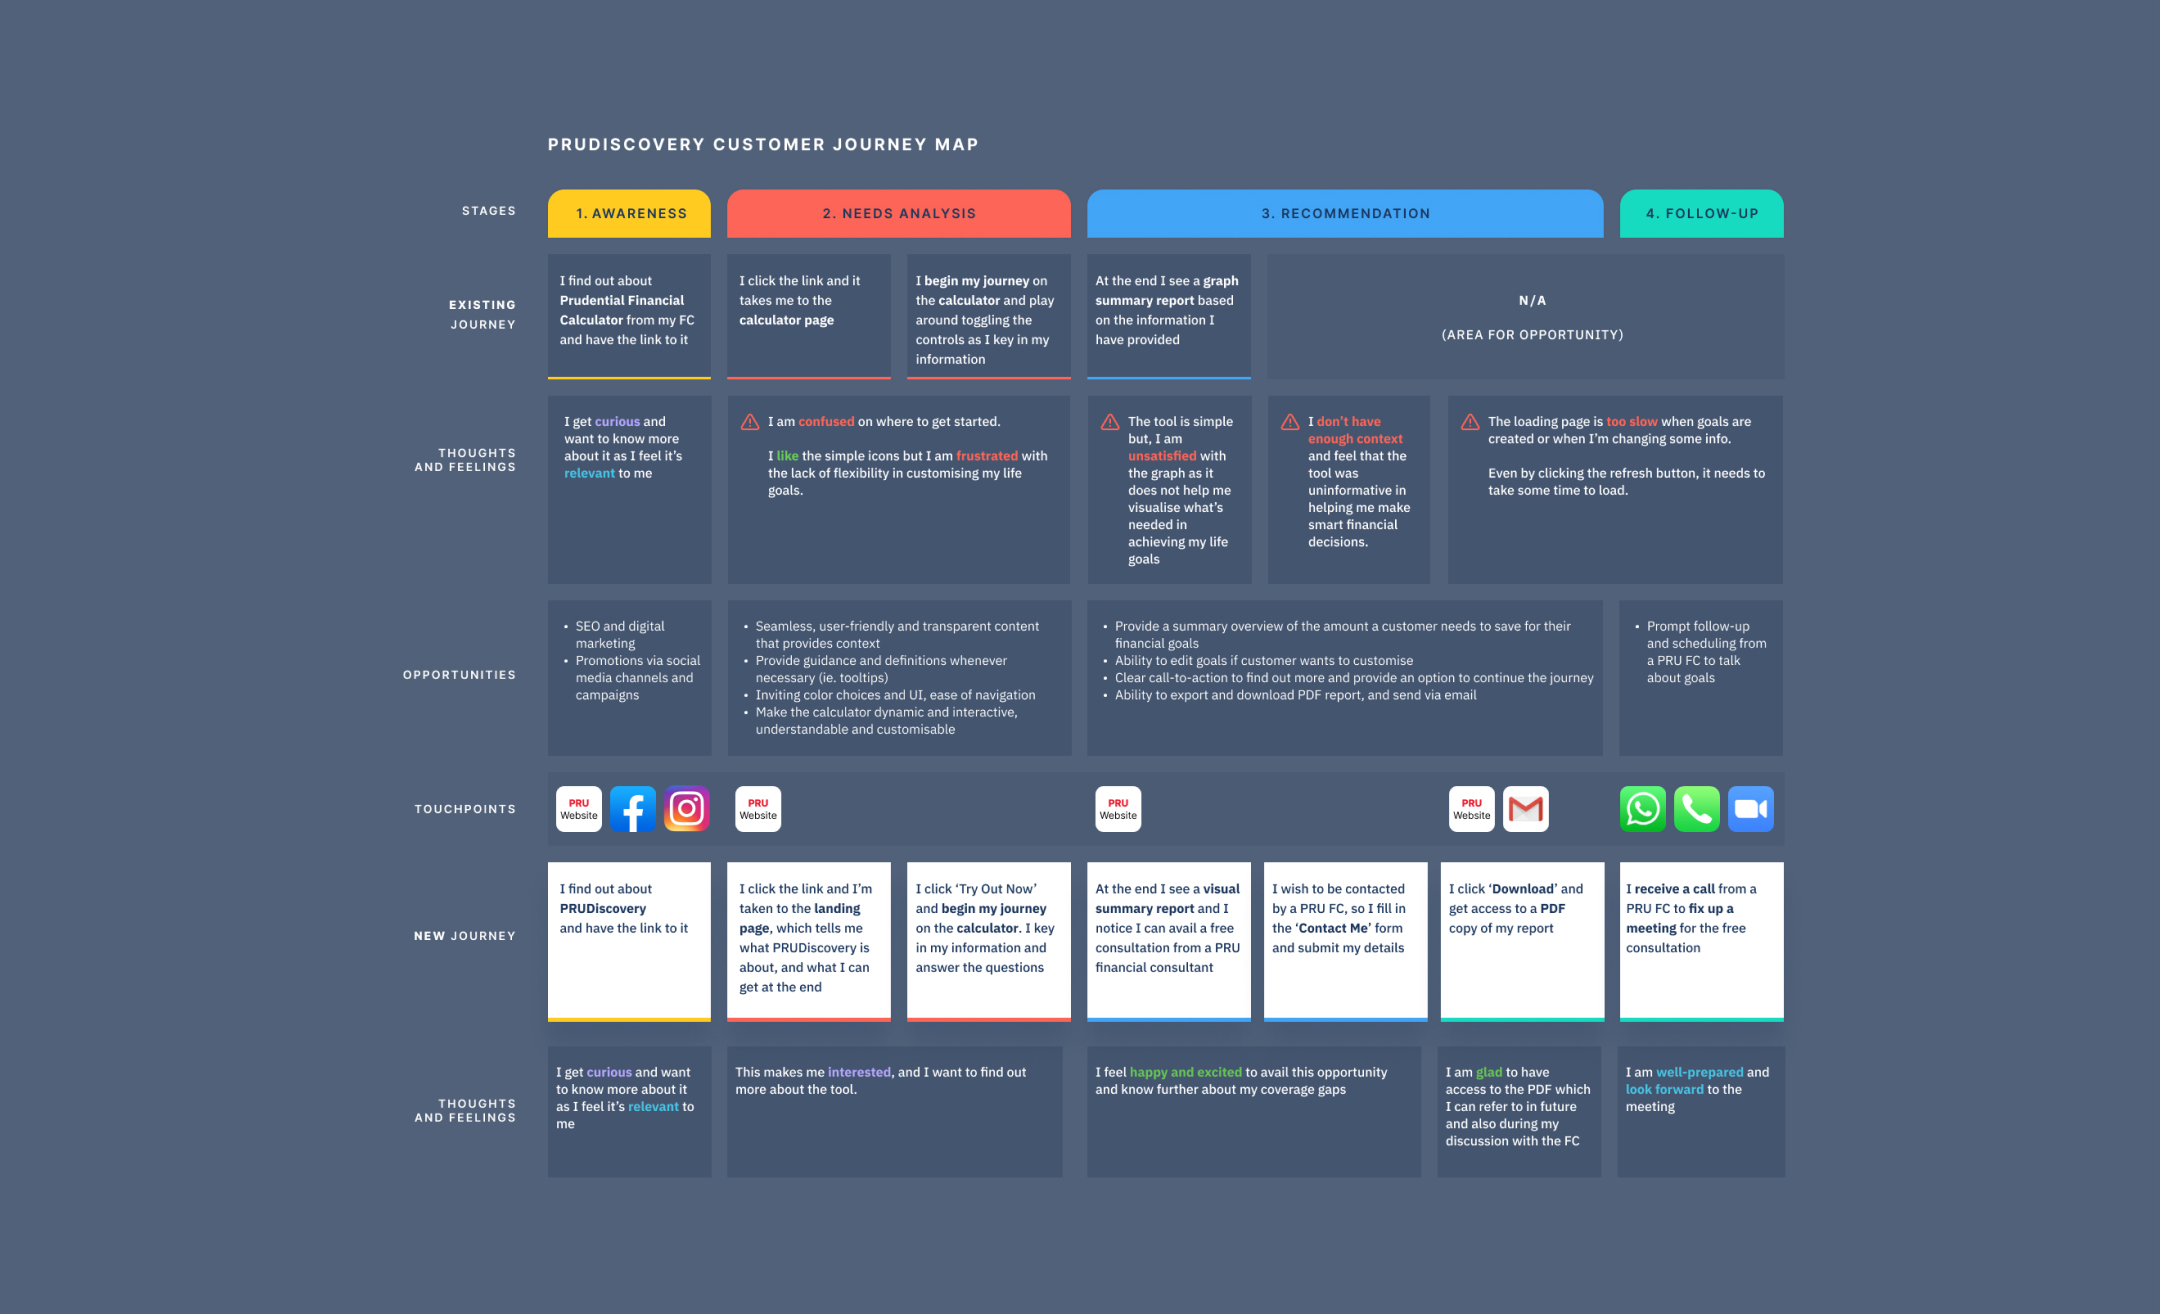
We worked closely with the Customer Insights team and our PRUforYou customer panel to run a series of workshops and interviews with 6 Prudential customers and 6 financial consultants to uncover their needs, frustrations and expectations and created a customer journey map to have a holistic view.
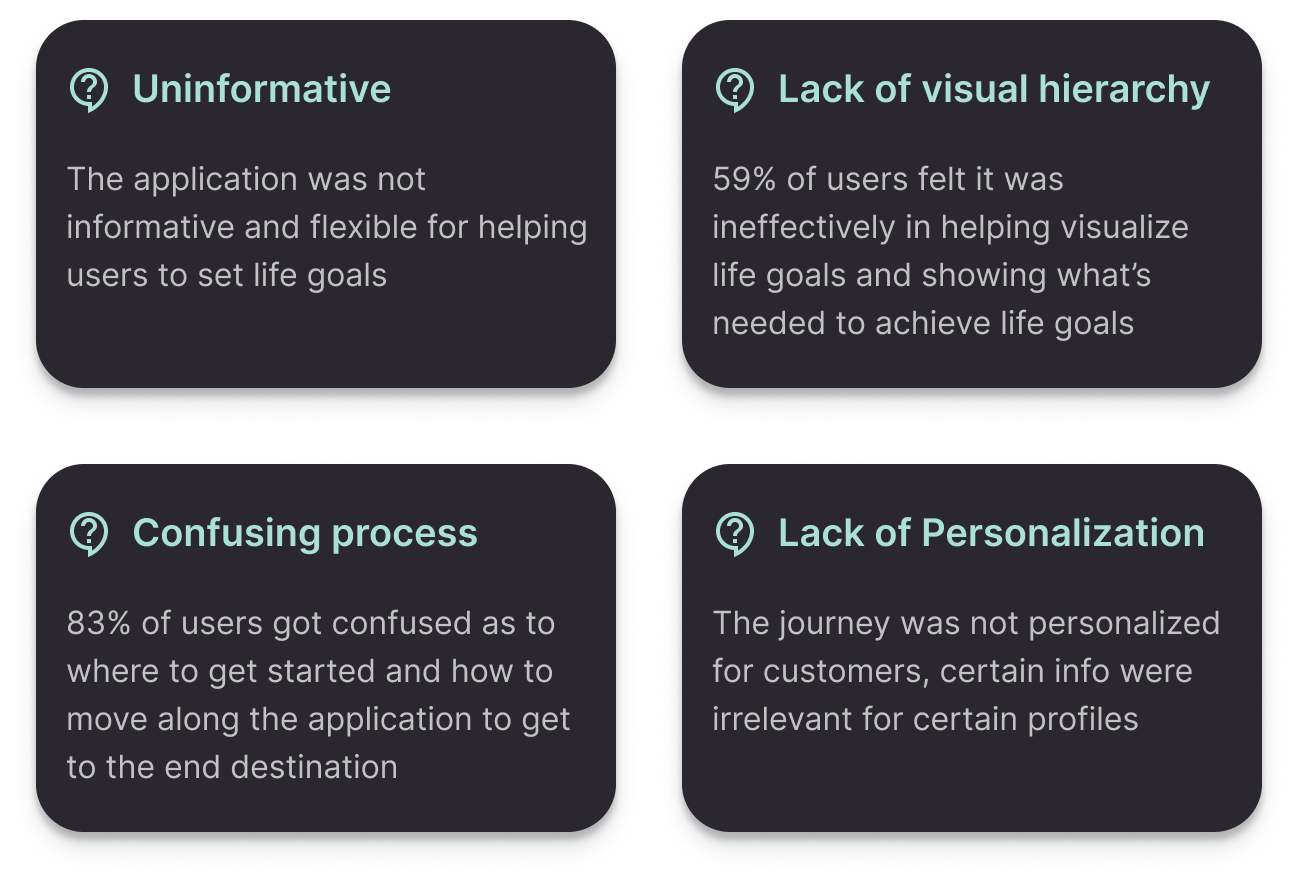
Frustrations
Needs and Expectations
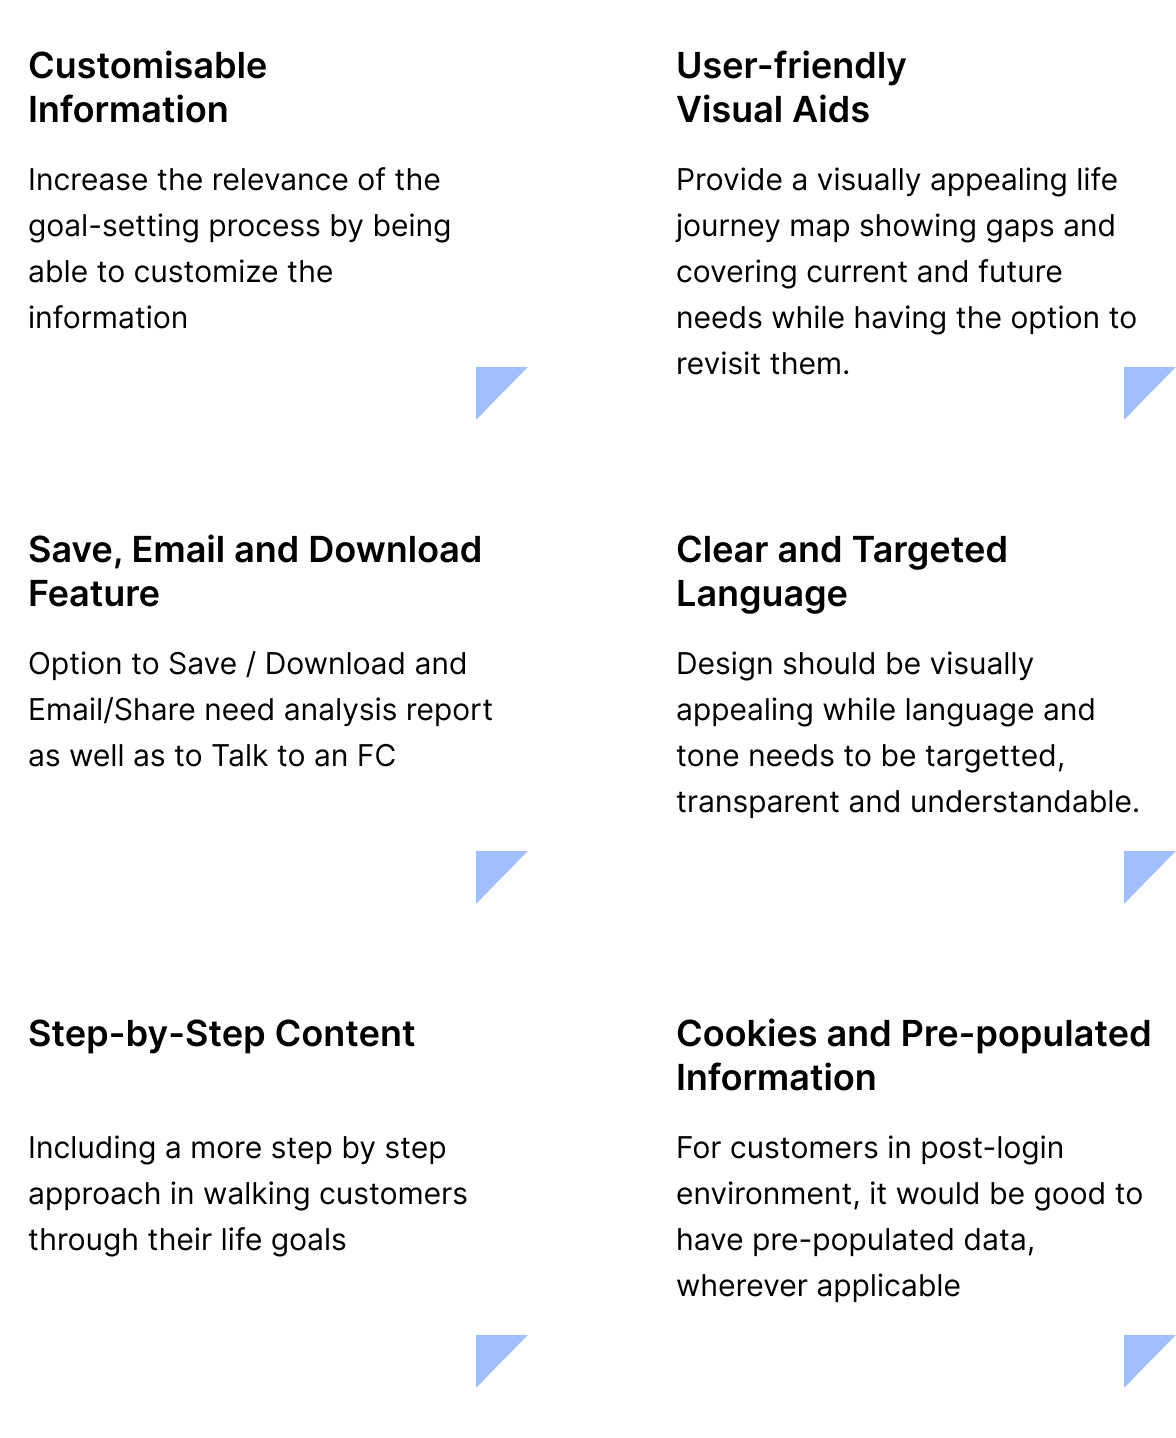
Closer Understanding in
Defining the Experience
Security and Risk Checks
Having a 'Save' option and the ability to have pre-populated data is definitely a time-saver, however it raised a few flags as it involved keeping customer data for an undefined time period.
We placed those features on hold to test and see if the demand is still high post-launch, whilst we come up with other alternatives.
Overall, these wealth of insights helped us discover opportunities for success as we started to see a huge business opportunity. By overcoming and addressing these challenges and needs, we knew that the result would be a simple, intuitive experience that builds trust with our customers while also generating more data, nurturing opportunities and insights that we needed.
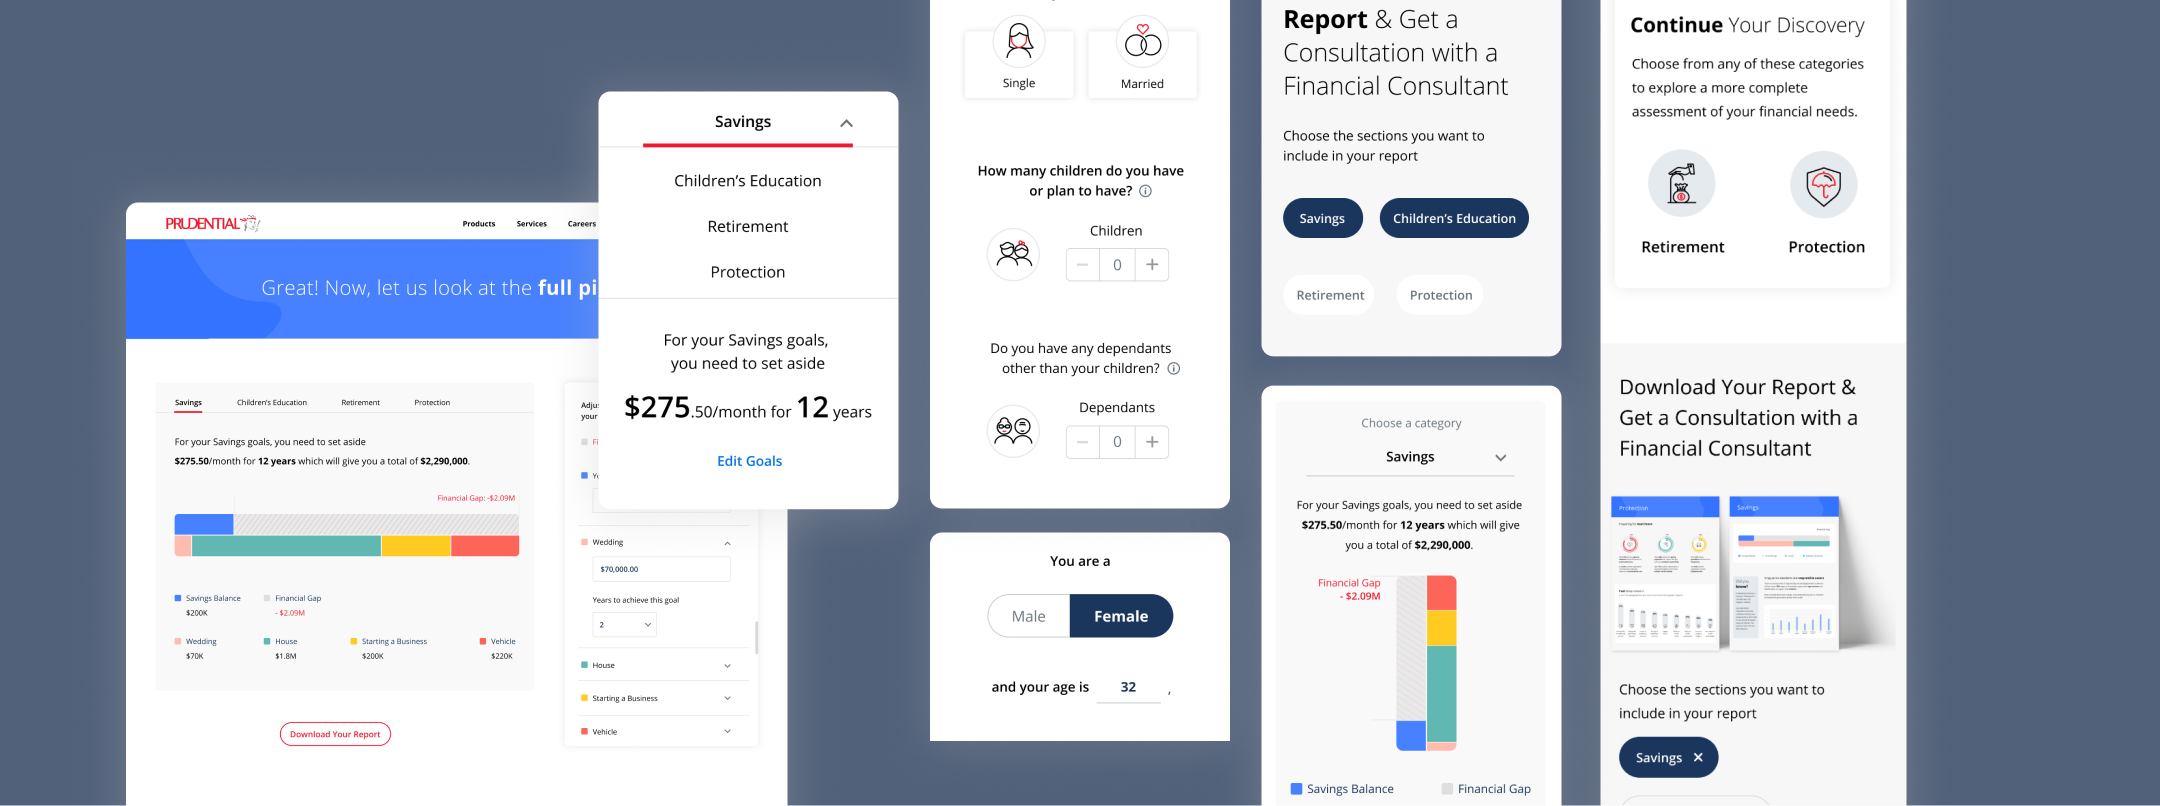
Final designs
After rounds of research, workshops and evaluation of third-party platforms, our present-day solution was re-designed and built on top of our existing financial needs calculator that we currently have. Our previous exercises and discovery sessions formed a great foundation for establishing and informing the UI and flow of the journey. As our pre-sales customer engagement tool, we made it more engaging, exciting and user-friendly for our prospects and customers.
Landing page
The engaging landing page ensures visual appeal while keeping language and tone targeted, transparent and easy to digest.
Recognizing the importance of clarity, we made it a priority to communicate the benefits, process and informed the customer what they were getting out of the tool beforehand, so they could make better and more informed decisions in identifying their financial gaps.
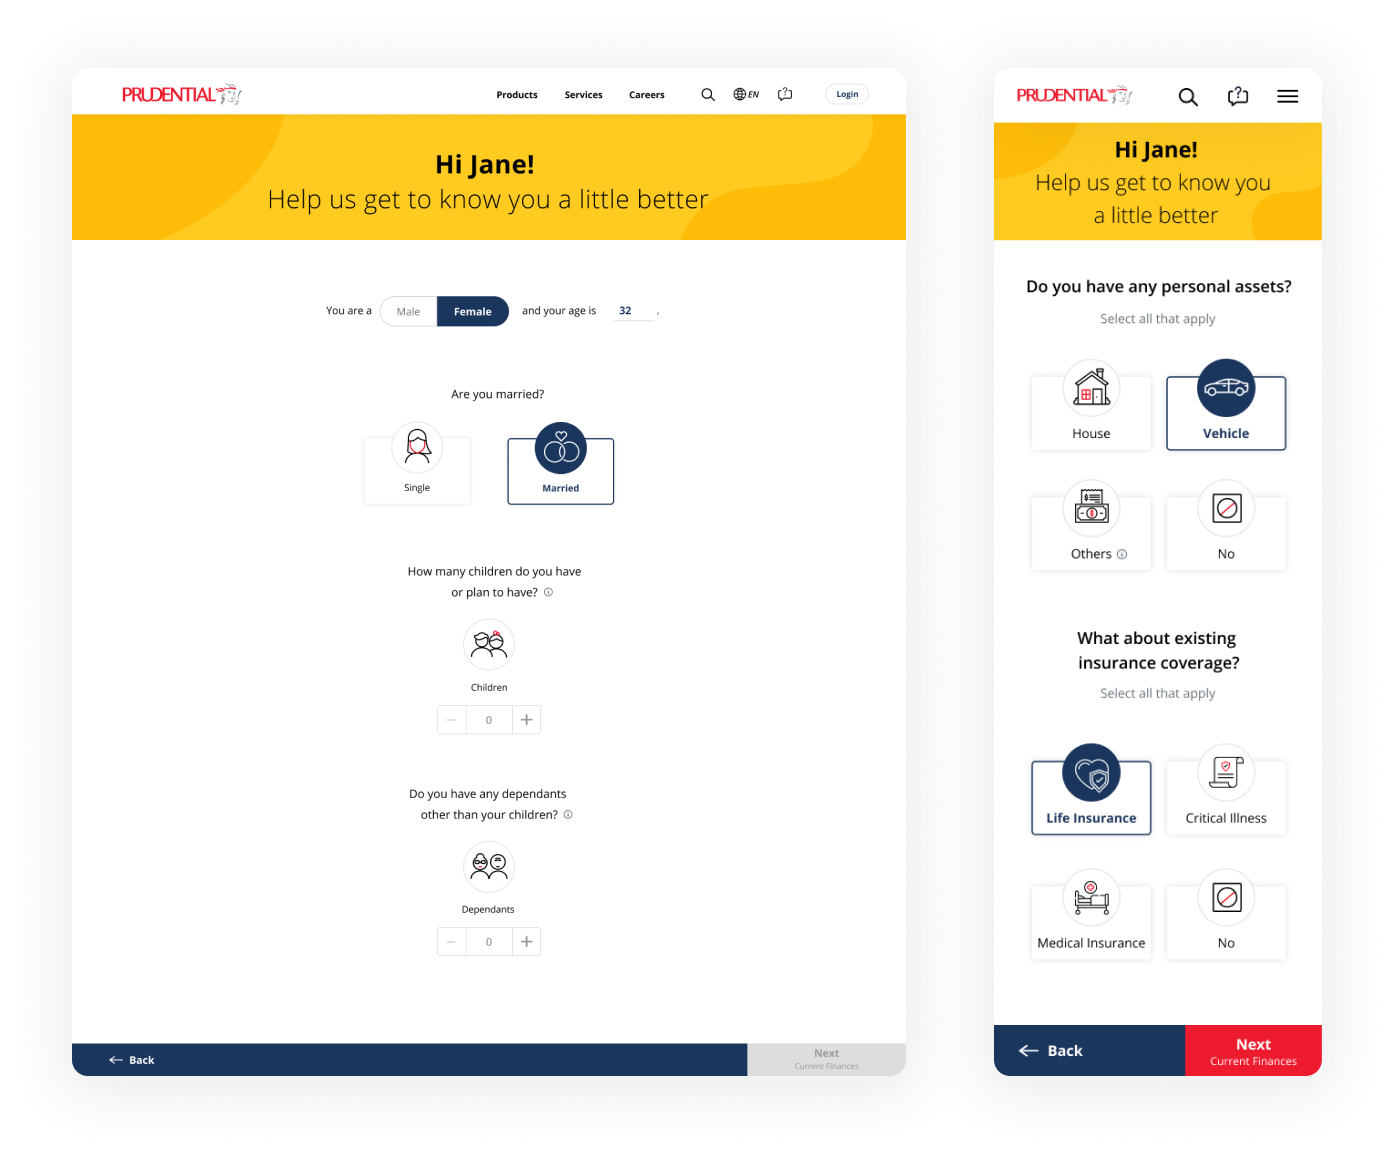
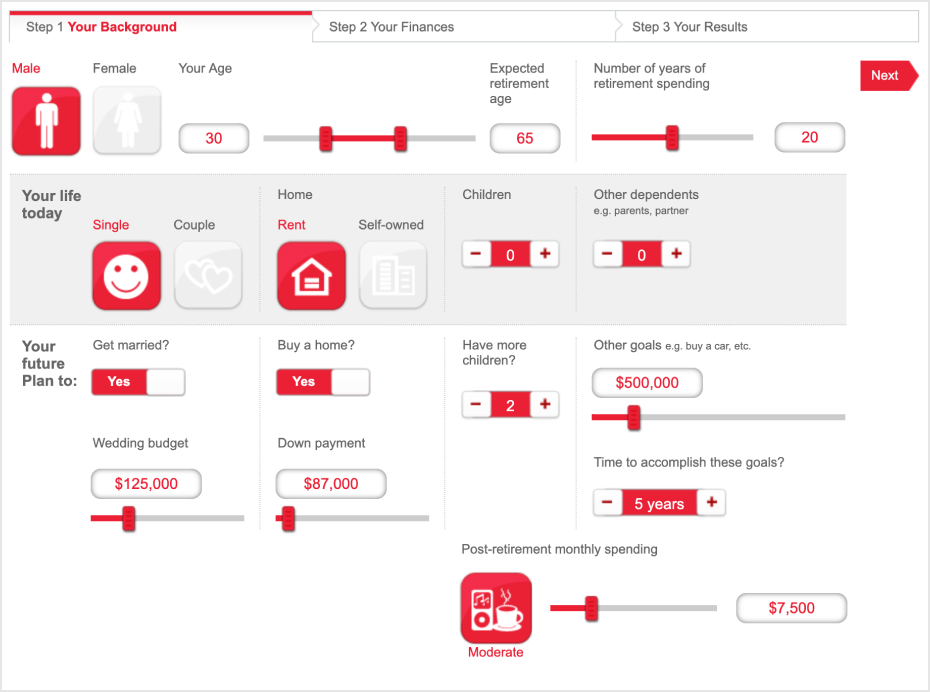
Making form-filling more engaging
We didn’t want ‘form-filling’ to feel like a chore, so we broke down content into bite-sized information and made use of large iconic buttons to create contrast while making it more fun and engaging on whatever device a customer uses the tool on.
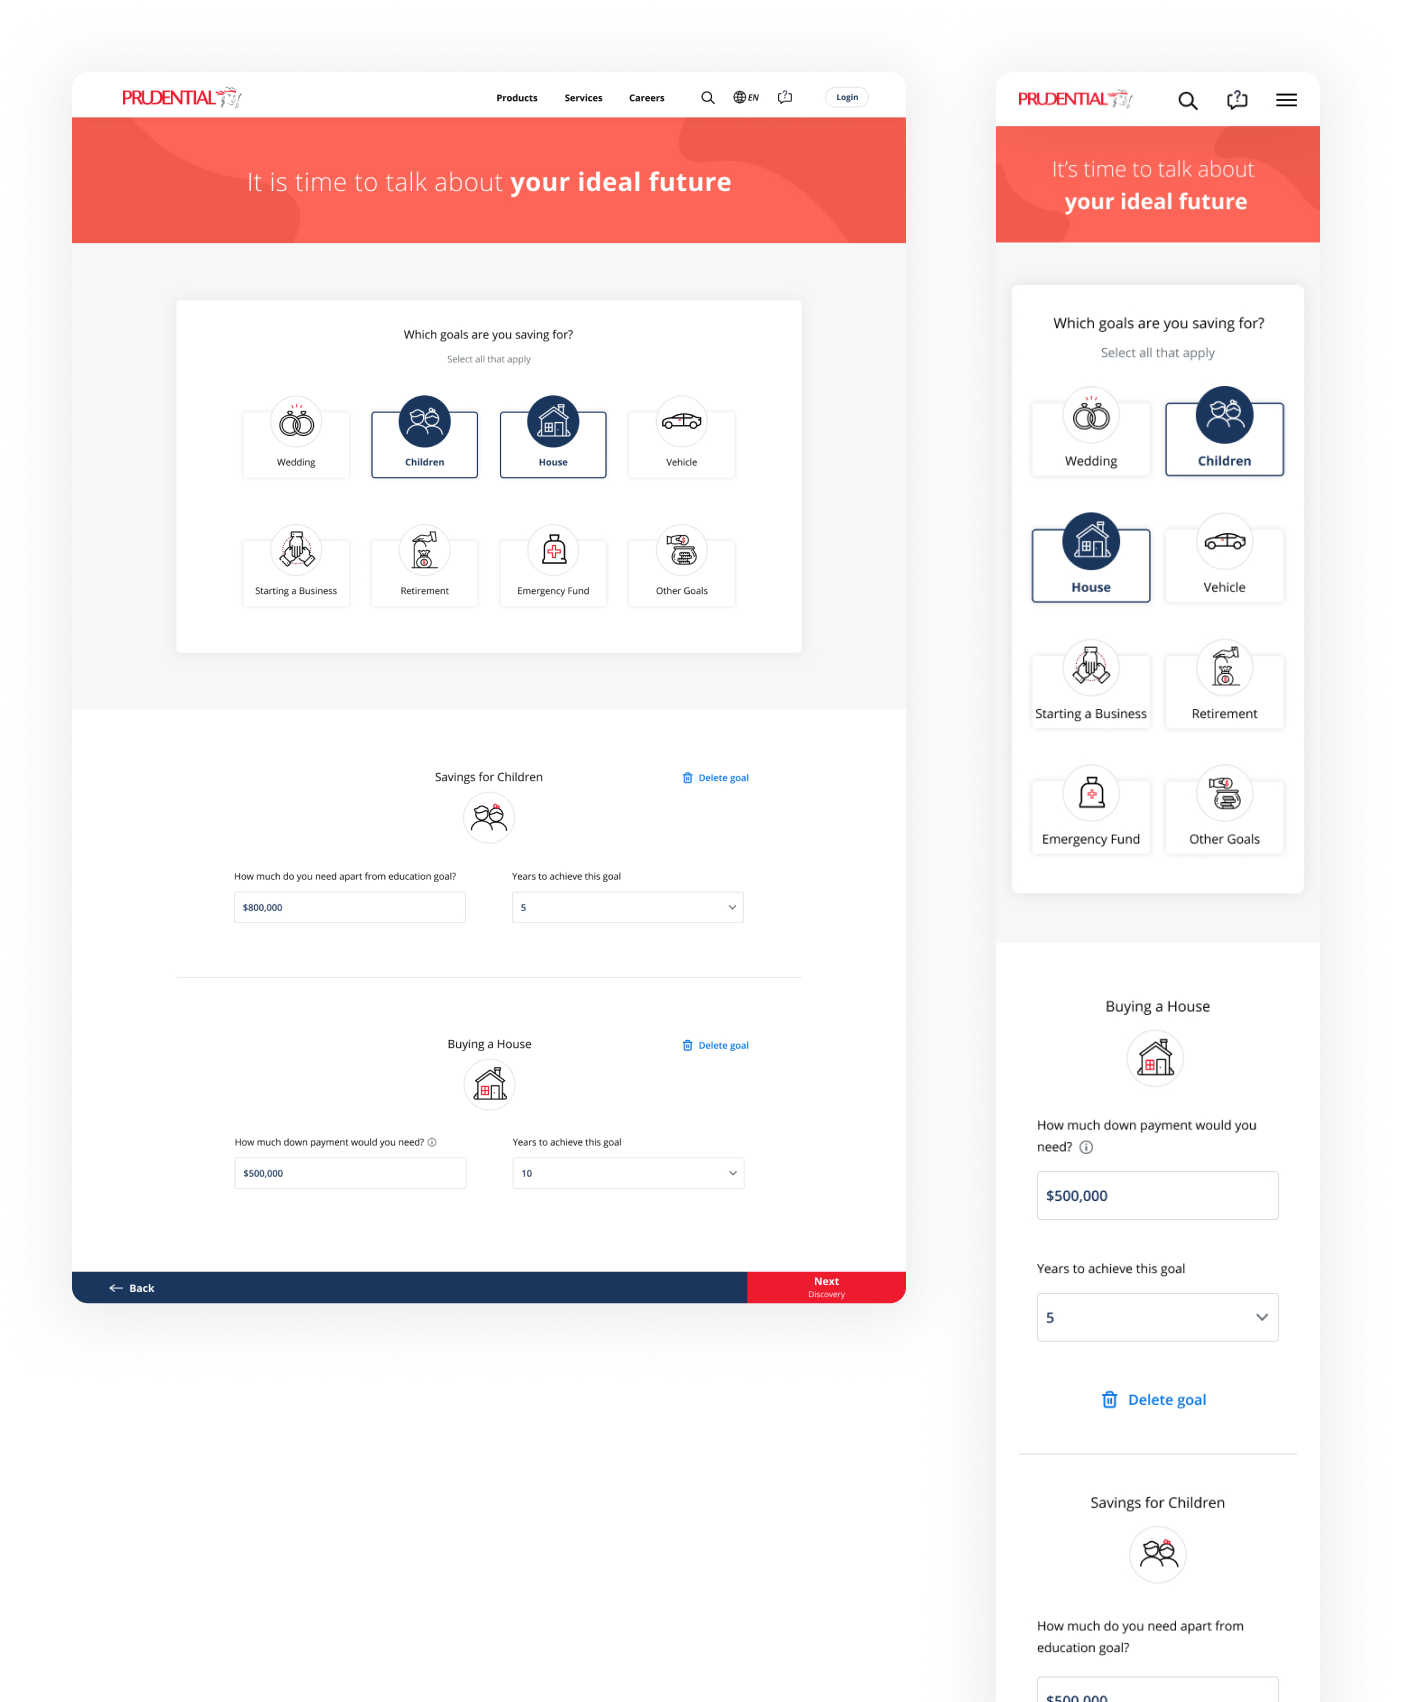
Dynamic and conditional questions
Information that is asked about the customer is dynamic and conditional. This way, they only view information and answer questions relevant to what they have previously entered.
For example, if the customer initially entered that they have children in the section before, all the subsequent questions takes that into consideration in goal planning.
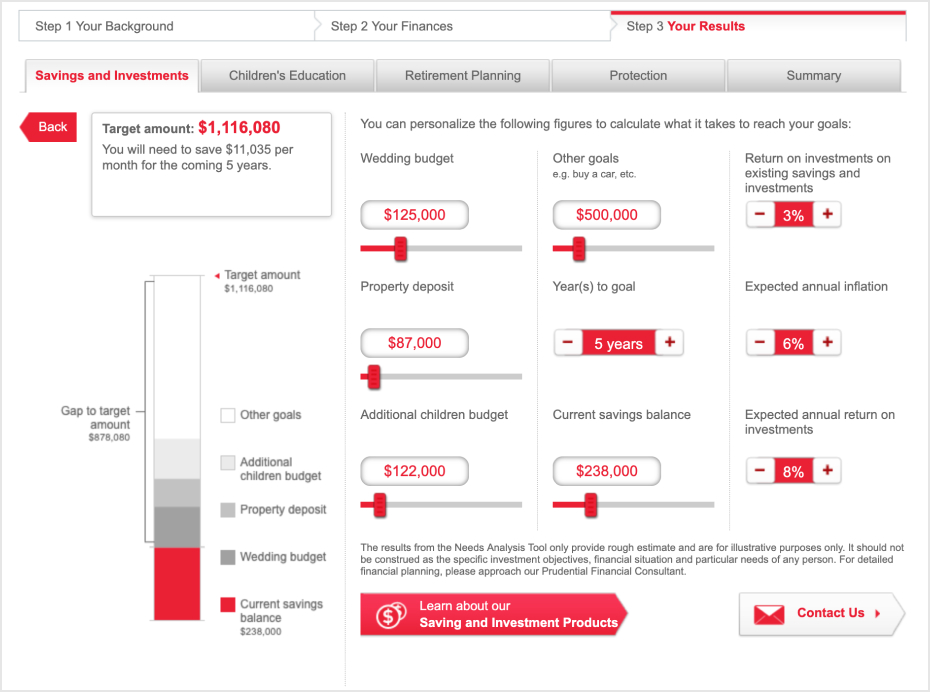
After a few rounds of usability testing with our PRUforYou customer panel, we learned insights that proved problematic in our initial designs:
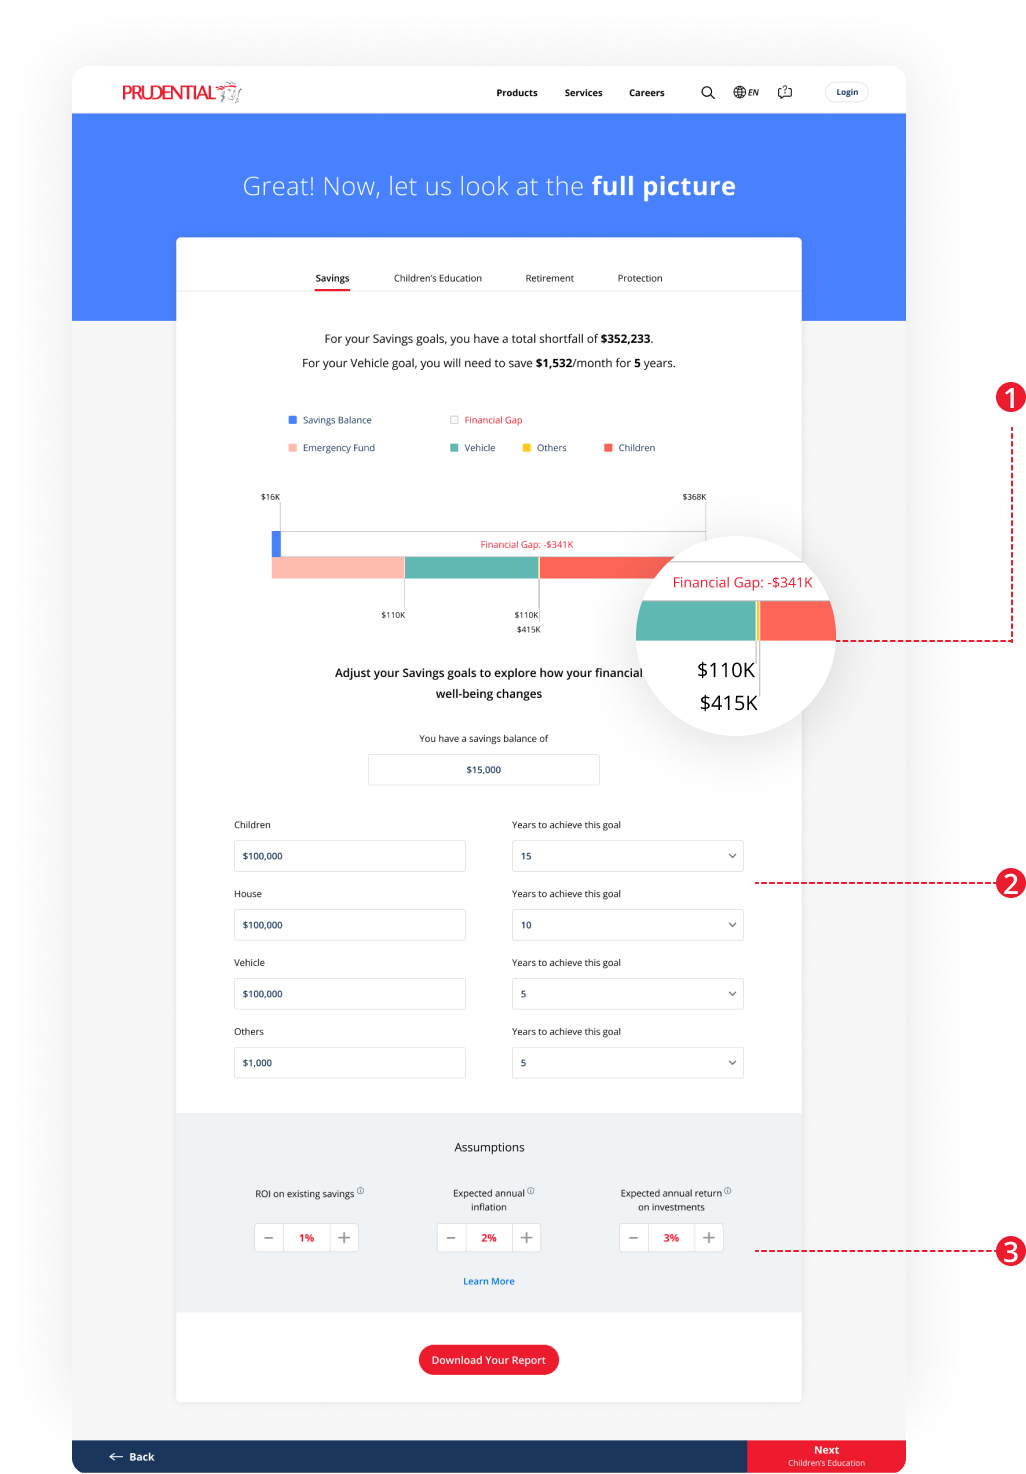
Cluttered numberings
In certain edge cases where two or more parameters are closely spaced, the information can become challenging to read as the numbers may overlap each other.
Unnecessary back-and-forth scrolling
With many goals, the page becomes too long to scroll through easily, making it hard to quickly view changes in the summary, graph, and goal-setting sections, causing unnecessary effort.
Unclear section
It is not clear that the assumptions section is part of the dynamic calculation that takes place above.
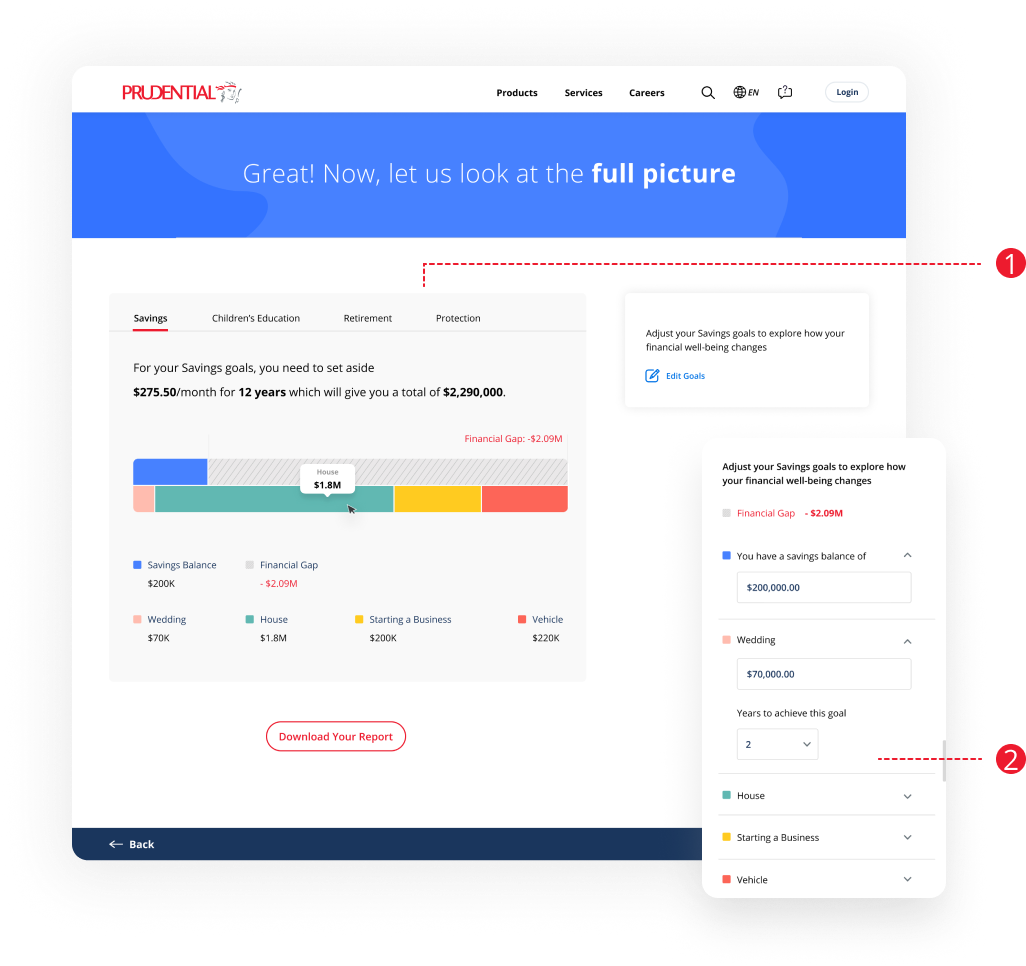
Solution
Removed the numberings and grey line indicator, and grouped the numbering with the legend together so that users can easily read each goal’s value.
Value tooltip appears when users mouse over the graph, saving more space and making information more intuitive.
Solution
Instead of expanding all goal settings following the graph, added a button ‘Edit Goals’ to trigger the settings, when only users want to change their goals. Making it clearer for users to view the information and guide them through the process.
Launch and results
Once we finalized the details, we partnered closely with our engineers during the launch to ensure that no comma or pixel was out of place. We did this by taking screenshots of the experience in a browser, listing down all the items on a shared tracker, and marking up our changes in Figma.
While we were confident that the designs provided a better experience for our customers, we’ve received a lot of positive feedback from them. We wanted to see an increase in the number of people who chose to move forward and we did — as of Oct 2021, double digit increase in completion rate through this redesign, and financial consultants received more leads via this channel.